
【中英双语】下一个数字化大优势,为什么是数据图谱?

The Next Great Digital Advantage
维贾伊·戈文达拉扬(Vijay Govindarajan) 文卡特·卡特拉曼(N. Venkat Venkatraman)| 文

Of the 4,000 products Amazon sells every minute, approximately 50% are presented to customers by its personalized recommendation engine. When you visit the site, its algorithms select an assortment of products from about 353 million items and arrange them for you according to what they predict you will want at that precise moment.
亚马逊每分钟卖出四千件商品,其中约50%是由个性推荐引擎呈现给用户的。浏览亚马逊网站时,算法会预测你在此时此刻想要的东西,从约3.53亿商品里选出一组推送给你。
These recommendations are powered by Amazon’s ever-evolving purchase graph, which is a digital representation of real-world “entities”—anything about which it stores information, such as customers, products, purchases, events, and places—and the relationships and interrelationships among them. Amazon’s purchase graph connects purchase history with browsing data on the site, viewing data on Prime Video, listening data on Amazon Music, and data from Alexa-enabled devices. Its algorithms use collaborative filtering—incorporating factors such as diversity (how dissimilar the recommended items are); serendipity (how surprising they are); and novelty (how new they are)—to generate some of the most sophisticated recommendations on the planet. Thanks to its rich data and industry-leading personalization, Amazon now owns 40% of the U.S. e-commerce market; its closest rival, Walmart, has a market share of only 7%.
驱动个性推荐的是亚马逊不断演进的采购图谱,即现实中“实体要素”——客户、产品、采购、活动和店址等一切店铺信息——以及这些要素之间关系性的数字化呈现。亚马逊的采购图谱将购买历史与网站浏览情况、Prime Video观看情况、亚马逊音乐收听情况和来自Alexa设备的数据联系起来,算法使用协同过滤,结合多样性(推荐商品的相异程度)、意外性(推荐商品的惊人程度)和新奇性(新鲜程度)等要素,生成世界上最复杂的推荐。凭借丰富的数据和行业领先的个性化推荐,亚马逊现在占有美国电商市场的40%,跟得最紧的对手沃尔玛市场份额仅为7%。
To compete with Amazon, in April 2021 Google announced its Shopping Graph, an AI-enhanced model that recommends products to users as they search. More than a billion people research products on Google each day, and Shopping Graph connects them with more than 24 billion listings from millions of merchants across the web. It builds on Google’s unparalleled Knowledge Graph, which captures information about the entities in its vast network and the relationships among them, including structured and unstructured data from Android, voice and image search, Chrome browser extensions, Google Assistant, Gmail, Photos, Maps, YouTube, Google Cloud, and Google Pay. With its Shopping Graph—which lets 1.7 million merchants feature relevant listings across Google using simple but interlinked tools—Google is ready to meet Amazon’s challenge.
为了与亚马逊竞争,谷歌于2021年4月宣布推出购物图谱(Shopping Graph),一个在用户搜索时推荐商品的AI模型。每天用谷歌搜索商品的人超过10亿,购物图像将他们与全网几百万商家超过240亿商品列表联系起来。这个模型的基础是谷歌绝无仅有的知识图谱(Knowledge Graph),在广阔的网络中捕捉关于实体及其相互关系的信息,包括来自安卓系统、声音及图像搜索、谷歌浏览器Chrome扩展、谷歌助手、谷歌邮箱、谷歌照片、谷歌地图、YouTube、谷歌云服务和谷歌支付的结构化与非结构化数据。谷歌购物图谱让170万商家运用简单却相通的工具在谷歌上展示相关商品,谷歌可以应对亚马逊的挑战。
Datagraphs like Amazon’s and Google’s rely on product-in-use data—that is, data on the behavior of customers as they use a platform or a product—to capture the connections, relationships, and interrelationships between a company and its customers. The datagraph concept is inspired by social network and graph theory, wherein a social graph is defined as a representation of the interconnections among individuals, depicted as nodes, and the relationships among them—with friends, colleagues, supervisors, and so on—represented as links. The concept derives from the work of the social psychologist Stanley Milgram, and over the past two decades, it has provided a useful lens for analyzing the structure and dynamics of organizations, industries, markets, and societies. Facebook popularized the digital social graph in 2007 when it introduced Facebook Platform, a tool that allowed developers to build applications that were integrated into the site’s information flow and connections of relationships.
像亚马逊和谷歌这样的数据图谱,依赖产品使用数据(即用户使用平台或产品时产生的行为数据)把握企业及其客户之间的联系和关系。数据图谱的概念源于社交网络与图形理论,该理论将社交图谱定义为人与人之间联系和关系的呈现,如朋友、同事、上司等,每个人被呈现为一个节点,关系则是点与点间的连接。这个概念出自社会心理学家斯坦利·米尔格拉姆(Stanley Milgram)的著作,过去二十年来,这一概念为分析组织、行业、市场和社会的结构与动态提供了实用的透镜。2007年,Facebook推出同名社交平台,让开发者打造应用程序整合进网站信息流和人际关系连接,使得数字化社交图谱流行起来。
Leading technology companies are using datagraphs to personalize customer recommendations, update products, optimize advertising, and more. The most successful examples—which include Amazon’s purchase graph, Google’s search graph, Facebook’s social graph, Netflix’s movie graph, Spotify’s music graph, Airbnb’s travel graph, Uber’s mobility graph, and LinkedIn’s professional graph—leverage the ongoing collection of customer engagement data, coupled with proprietary algorithms, to outcompete rivals in every way, from product creation to user experience.
领先的科技公司运用数据图谱提供个性化推荐、升级产品、优化广告等等。最成功的例子,如亚马逊的采购图谱、谷歌的搜索图谱、Facebook的社交图谱、奈飞的电影图谱、Spotify的音乐图谱、Airbnb的旅游图谱、优步的出行图谱和领英的职业图谱,利用不断收集的用户使用数据,加上独有的算法,从产品开发到用户体验等各方面甩开了竞争对手。
This article discusses how companies can learn from the best practices of datagraph leaders to gain new competitive advantage.
本文讨论企业如何借鉴数据图谱领先企业的方法,打造新的竞争优势。
Data Network Effects
数据网络效应
To understand datagraphs, we first need to understand data network effects, which occur when data generated by users as they engage with a product or service makes it more valuable for other users. Unlike direct network effects, in which the value of a service grows as additional users join (as with Facebook or LinkedIn), data network effects do not require increasing numbers of users to enhance the value of the network. Instead, the continued engagement of current users generates broader and deeper product-in-use data, which allows algorithms to generate ever-improving results. For example, every one of Google’s 2 trillion annual searches helps the company enrich its Knowledge Graph and improve its search engine, which generates better and better search results for users. By contrast, if users stop engaging on the platform, it becomes stale and less useful.
要了解数据图谱,首先要了解数据网络效应,即用户使用产品或服务时产生的数据让这项产品或服务对于其他用户更有价值的效应。不同于价值随着更多用户加入而增长的直接网络效应(如Facebook和领英),数据网络效应不需要增加用户数量来提升网络价值,而是已有用户持续使用、产生更加广泛深入的使用数据,让算法能够产出不断完善的结果。举例来说,谷歌每年的两万亿次搜索,帮助谷歌公司充实知识图谱,改进搜索引擎,为用户提供更好的搜索结果。而如果用户不再使用平台,平台服务质量的改善就会陷入停滞,不再那么有帮助。
Datagraphs are not static; they do not reflect information at a snapshot in time. They are dynamic, reflecting what data scientists refer to as data in motion. That’s partly why it is impossible to manually draw a datagraph. Technology is needed to gather and interpret in real time the data on the millions of units of a company’s products that consumers worldwide may be engaging with at any given moment.
数据图谱不是静止不变的,反映的不是某一时间点的数据,而是数据科学家所说的动态数据。这是无法手动绘制数据图谱的部分原因。必须利用技术,才能实时收集和解读一家公司的产品在全世界消费者使用中产生的几百万份数据。
Datagraph Success Factors
数据图谱成功要素
Datagraph leaders gather customer behavioral data and quickly incorporate what they learn to improve every aspect of their products and services. They constantly refine how they classify and label product data and uncover relationships among entities so that algorithms can better group offerings for personalized recommendations. And they continually update their algorithms so that the personalized recommendations are based on the most current and relevant data, which helps improve and prolong customer engagement. Let’s take a look at the key behaviors of companies that use datagraphs successfully.
数据图谱领先企业收集用户行为数据,并迅速用于改进产品和服务的各个方面。这些公司不停地修改为产品数据分类和标记的方法,寻找实体间的关系,以便算法更好地归类并提供个性化推荐。公司还不断更新算法,以最新、最相关的数据为基础生成个性化推荐,协助吸引客户。下面看看成功运用数据图谱的企业有哪些关键行为。
They learn at scale and speed. Datagraphs capture how individuals live, work, play, learn, listen, socialize, watch, transact, travel, spend, and do any other activity that can be associated with commerce. Digitalization has made it possible to observe and codify customer data in all these areas at scale, scope, and speed. Facebook’s social graph, for example, analyzes data on 2.8 billion individuals and their social activities from moment to moment: what they’re doing, whom they’re friending and unfriending, where they’re traveling to, what brands they’re talking about, what movies they’re watching, what music they’re listening to, and so on. LinkedIn’s professional graph captures in real time how 774 million professionals who work in more than 50 million companies and attended 90,000-plus educational institutions respond to job postings, status updates, and live videos. Moreover, it maps members to other entities, such as the skills they have, to serve users targeted ads, learning suggestions, news feeds, and more. LinkedIn is now a subsidiary of Microsoft and part of its data ecosystem, which allows it to create an even more vibrant datagraph.
快速广泛学习。数据图谱抓取的是个人的生活、工作、娱乐、学习、收听、社交、观看、交易、出行、消费等等一切可以与商业联系在一起的活动情况。数字化让公司得以广泛、透彻、迅速地观察和整理这些方面的客户数据。例如Facebook的社交图谱,每时每刻分析28亿人及其社交活动的数据:他们在做什么、与谁成为好友和解除好友、去了哪里、在讨论什么品牌、在看什么电影、在听什么音乐等等。领英的职业图谱实时抓取供职于5000万家公司、参与9万多家教育机构课程的7.74亿专业人士如何回应招聘信息、更新状态、使用直播视频。此外,职业图谱还根据用户技能等其他要素,为用户提供有针对性的广告、学习建议、新闻推送以及更多信息。现在领英是微软子公司,被纳入微软的数据生态系统,得以创造更有活力的数据图谱。
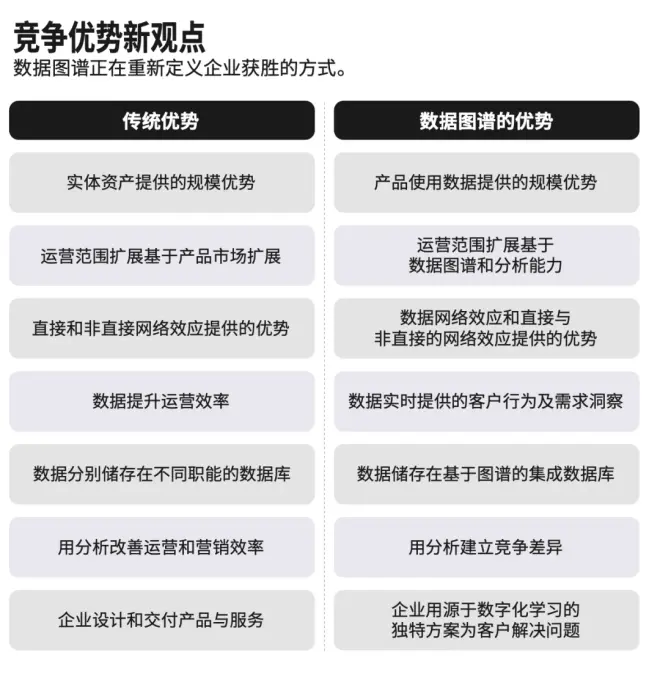
At traditional companies, customer data is stored as independent records in various functional databases. To gain digital advantage, companies must organize data as a graph of interactions that are analyzable by algorithms that provide insight and deliver personalized value to every customer.
传统企业的用户数据各自独立储存在不同职能部门的数据库。为了获取数字优势,企业必须将数据组织成交互图谱,可运用算法分析,生成洞察并为每一位客户提供个性化价值。
They use datagraphs to enrich product offerings. Datagraph leaders organize their knowledge and expertise in machine-readable graph formats with a set of concepts—such as shopping, travel, or search—across categories. Take Airbnb’s travel graph. It depicts an inventory of more than 7 million homes, tagged in terms of entities (cities, landmarks, events, and so on), attributes (such as customer reviews and hours of operation), and the relationships among them to yield ever-improving recommendations about not just the type of house to rent but also the best places for dinner or the best times to visit attractions. This ability to expand the product scope allows Airbnb to serve its customers better than traditional hotels, whose data is housed in departmental silos (reservations for the room booking, concierge for restaurant recommendations, spa for massage appointments, and so on). Similarly, Netflix continually improves how it represents and classifies movies and television shows across 75,000 microgenres (just as Spotify does with music and podcasts).
用数据图谱丰富产品线。在数据图谱方面领先的企业用购物、出行或搜索等一系列跨领域的概念,将专业知识整理为可由机器识别的图谱格式。例如Airbnb的出行图谱,给出了700多万住宅的清单,打上属性(所在城市、地标、活动等)、特征(顾客评价和营业时间等)和彼此间关系的标签,生成更高级的推荐,不仅推荐出租屋,还可以推荐最佳晚餐场所和游览景点的最佳时间。这种扩大产品范围的能力让Airbnb为顾客提供优于传统酒店的服务,后者的数据被分别储存于彼此孤立的部门(订房部负责预订房间、礼宾部负责推荐参观、疗养部负责预约按摩,等等)。同样,奈飞也不断改善影视作品在7.5万个细分类别下呈现和分类的方式,Spotify的音乐和电台节目亦然。
They win customers’ moments of truth. In 2001, only 2% of Netflix’s recommendations were chosen by its 456,000 users. By 2020, the percentage had increased to 80%, and Netflix had more than 200 million subscribers. Netflix uses its movie graph to win the “moment of truth”: the 90-second-to-two-minute window in which a viewer decides to watch something on Netflix or go elsewhere. Netflix algorithmically customizes and updates its home screen to continuously deliver targeted recommendations for every subscriber. By 2015, Netflix had prevented more than $1 billion a year in canceled subscriptions thanks to its personalized recommendation engine.
在关键时刻赢得客户。2001年,奈飞有45.6万用户,给出的推荐中只有2%被选择。2020年这个比例提升到80%,奈飞订阅用户超过了2亿。奈飞运用电影图谱,把握住了赢得用户的“关键时刻”:90秒至2分钟的窗口期,观众会在这段时间里决定是在奈飞上观看影视作品还是转向其他网站。奈飞根据算法对首页进行定制化和更新,持续为每一位订阅用户提供个性化推荐。至2015年,奈飞每年凭借个性化推荐引擎避免的订阅取消量价值超过10亿美元。
To win its moments of truth, Facebook conducts A/B experiments across 3 billion users in near real time to personalize the social feeds of each user. Before Facebook displays a post, it sorts through an inventory of possibilities and narrows them down to about 500 that past behavior patterns suggest a user is likely to engage with. Then, Facebook’s proprietary neural network scores the posts and ranks them before arranging them in a variety of media types, such as text, photos, sounds, and videos interspersed with ads.
Facebook为了在关键时刻获胜,对30亿用户分别进行了近乎实时的个性化社交网络内容对照测试。推送内容之前,Facebook会在待推送清单中筛选,根据用户过往行为规律,将范围缩小至约500篇该用户可能关心的内容。随后Facebook会用专有的神经网络为这些内容打分并排序,再按媒体类型整理,如文本、照片、音频和带有广告的视频等。
Although many companies claim to be customer-centric, few use datagraphs and algorithms the way these leaders do. Ask yourself: Are we using AI-powered algorithms to deliver customers an ever-more-refined product offering to make sure they engage with our product rather than move on?
虽然许多公司号称是以客户为中心,但能像领先企业一样善加运用数据图谱和算法的却很少。想一想:你的公司是否用AI算法为客户提供不断改善的产品,让他们不会转向其他公司?
Getting Started
开始行动
The first thing businesses that wish to remain competitive against datagraph leaders must understand is that a successful strategy isn’t solely dependent on having large volumes of information. It’s about collecting relevant product-in-use data in real time to achieve data network effects and build advantage. When businesses observe more customer interactions with their products, they accumulate richer data; when they sell more products to a more-diverse group of users, they accumulate more-varied data that helps them further differentiate their offerings. Businesses that aren’t using datagraphs or have yet to do so successfully must take the following steps to catch up:
若想与数据图谱领先企业抗衡,必须明白一件事:战略成功不只取决于是否拥有大量信息,还要实时收集相关的产品使用数据,实现数据网络效应并打造优势。如果能观察到更多用户与产品的互动,企业就能获得更丰富的数据;将更多产品卖给更加多样的用户群体,就能累积更为多样的数据,协助实现产品差异化。不善用数据图谱的公司可参考以下改进建议:
1. Develop a datagraph strategy. To get started, pair executives that have industry knowledge with data scientists to conceptualize your datagraph, examine its future trajectory, and sketch out plausible business implications. Many companies that don’t have the resources of an Amazon or a Netflix have already done this. For example, Stitch Fix was founded as a personalized fashion service in 2010 by a business school student; now, thanks in large part to its fashion graph, its market cap tops $1.6 billion.
1. 制定数据图谱战略。首先要让了解行业的高管与数据科学家配合,在概念上构建数据图谱,考察未来走向并思考可能的商业影响。很多资源没有亚马逊或奈飞那么丰富的公司已经做到了这一点。例如2010年一名商学院学生创立的个性化时尚服务公司Stitch Fix,现在市值超过16亿美元,在很大程度上是因为其时尚图谱。
Ask yourself how your data offers a unique advantage to your business. You may possess proprietary “data hooks” that allow you to observe at the point of use detailed information that is unavailable to others. Your advantage may come from superior data scope (the depth and richness of your data) and access to complementary data from partners. You may have faster data speed (data in motion compared with a competitor’s episodic data, which is subject to batch processing). Consider how scale, scope, and speed can be increased through acquisitions (consider Microsoft’s acquisitions of LinkedIn and Activision) or alliances (such as Google’s partnership with Shopify).
思考本公司拥有的数据能否提供独特的优势。你或许有专有的数据收集法,能够获取其他企业无法获得的详细信息。也许你在数据深度和广度上有优势,并且可以从合作伙伴那里得到互补性的数据。你的流动数据(相对于竞争对手用于批量处理的零散数据)速度可能更快。想一想能否通过收购(如微软收购领英和动视)和结盟(如谷歌与Shopify合作)提升本公司的数据范围、深度和速度。
2. Develop proprietary algorithms. It’s no longer adequate to carry out different types of analysis independently. Datagraph leaders use proprietary algorithms to conduct descriptive analysis (“What happened?”), diagnostic analysis (“Why did it happen?”), predictive analysis (“What could happen?”), and prescriptive analysis (“What should happen?”) in an overarching framework. You can evolve your datagraph infrastructure from the legacy architectures designed to analyze data at rest (batch processing, independent analysis) to analyze real-time data in motion. Be sure to benchmark your algorithms against others in your industry—and against others of its class. For example, if your success metric is the extent to which customers act on your recommendations, how does the performance of your recommendation engine stack up against those of leaders like Netflix, Spotify, and Amazon?
2. 建立专有算法。独立进行不同类型的分析已经不够了。数据图谱领先企业运用专有算法,在总的框架下进行描述性分析(“发生了什么?”)、诊断性分析(“为什么发生?”)、预测性分析(“会发生什么?”)和规范性分析(“应该发生什么?”)。你的数据图谱基础设施可以从用于分析静止数据(批量处理、独立分析)的传统结构转为分析不断变化的实时数据。要参考行业中其他企业和同类其他算法。举例来说,如果你的成功指标是客户接受推荐的程度,你的推荐引擎与奈飞、Spotify和亚马逊等领先企业相比起来表现如何?
3. Engender trust. Being the custodian of customer data is a huge responsibility. Most customers regard computers, algorithms, and machine learning as complex black boxes, and many believe that their data is being used (even abused) to make digital companies rich and powerful. You must develop ways to use your algorithms to engender trust, and you must earn the right to gather, analyze, and deliver value through data. Explain what you’re doing using language that consumers can understand.
3. 建立信赖。管理客户数据责任重大。大部分客户将计算机、算法和机器学习看作复杂的黑匣子,很多人觉得数字化公司利用乃至滥用自己的个人数据大发横财。企业必须以能够获得信赖的方式使用算法,而且必须获得收集和分析数据的许可并提供价值。用消费者可以理解的语言解释你们公司要用数据做什么。
Trust gets eroded when consumers feel that their data is being misused. Every company must invest resources not only in the technical facets of algorithms but in explaining what they do in ways consumers understand and feel comfortable with. Customers increasingly expect to be informed about how digital products function and AI-supported services are delivered, and countries demand that companies tailor their data operations to local regulations.
如果消费者感到个人数据被滥用,就会对公司失去信任。企业不仅要在技术方面投入资源,还要以消费者能够理解和接受的方式做出解释。客户越来越期待能增进对数字化产品的了解,以及由AI支持的服务如何实现,各国要求企业在当地法律限制内使用数据。
4. Update the organization. Business leaders must allocate the resources necessary to upgrade the technology infrastructure required for datagraphs. They must recruit talent with breadth and depth in both data science and business. They must structure the data organization as the connective tissue that ties together all parts of the enterprise, recognizing that modern organizations must juggle two powerful, competing factions: those who believe in the supreme power of data and algorithms to solve problems and those who don’t. This tension defines the operating culture of modern organizations: Consider how Netflix CEO Reed Hastings balances the analytical pull of Silicon Valley with the creative pull of Hollywood.
4. 组织升级。企业领导者必须部署必要的资源,升级技术基础设施,达到数据图谱的要求。必须聘请在数据科学和商业两方面都具备广泛、深入知识的人才。必须将数据组织视为连接企业各部分的结缔组织,认识到现代组织必须妥善应对两个相互冲突的强力派别:一派相信数据和算法具备强大的解决问题能力,另一派则不相信。双方的矛盾正是现代组织运营文化的一大特色:如奈飞CEO里德·黑斯廷斯(Reed Hastings)平衡硅谷对分析的重视和好莱坞对创意的重视。
5. Monetize your datagraph. Datagraphs, when constructed to support and shape strategy, reveal that value lies not only in how products are designed and manufactured but also in how they solve specific problems for customers. Insights from datagraphs will help you choose the most appropriate monetization mechanisms and lay out clear pathways from data to business results. You can defend your current revenue and profits with compelling recommendations based on data network effects, just as Netflix uses real-time data to improve customer retention. You can also use your datagraph to develop more-thoughtful ways to expand your revenue and profit streams by going after new pockets of value, as Apple has done with its foray into credit cards, TV, and health care. And you can counterattack in markets where competitors have already mastered datagraphs, as Disney did with its successful entry into the streaming wars with Disney+.
5. 通过数据图谱获取利润。构建数据图谱用于支持和制定战略,表明价值不仅在于产品设计和制造,还在于如何为客户解决具体问题。数据图谱提供的洞察,会帮助你选择最合适的盈利机制,规划从数据到商业成果的清晰路径。你可以用基于数据网络效应的个性化推荐保住目前的收入和利润,如奈飞利用实时数据提升用户保留率;也可以利用数据图谱制定更加完善的方式,争取新的价值来源,拓宽收入和利润流,如苹果进军信用卡、电视和医疗行业;还可以反击市场中已经掌握了数据图谱的竞争对手,如迪士尼以Disney+成功进入流媒体行业。
Reshaping Advantage
重塑优势
We’ve all seen the signs in front of McDonald’s announcing, “Over X Billion Served” and have watched the number rise over the years. But tracking how many burgers are sold every year is a relic of the past. Datagraph leaders care less about absolute numbers. Instead, they ask: Do we have data on where each consumer buys her burgers? At what time? What does she drink with it? What does she do before or after buying a burger? Who are our customers and what are their ages, income, location, preferences, lifestyles, and so on? How can we satisfy more of their needs so that they spend more dollars with us than with someone else, feel confident that they got value for their money, and keep coming back?
麦当劳不断增加的“已经卖出x亿份”宣言,已经让我们看到了数据图谱的迹象。不过追踪每天、每月或每年卖出了多少汉堡只是过去的遗迹。数据图谱领先企业不再重点关注这种绝对的数字,而是提问:我们是否拥有关于每位消费者在何处、何时购买汉堡的数据?消费者搭配汉堡的饮品是什么?购买汉堡前后做了什么?我们的顾客是怎样的人,年龄、收入、所在地、偏好、生活方式等各方面如何?我们如何更好地满足顾客需求,让顾客在我们这里消费更多,并且感到物有所值、不断回购?
Datagraphs will reshape competition in every sector sooner than most expect. It’s time for every company to move beyond using data to improve operational efficiency and recognize the competitive advantage of datagraphs. Senior leaders must invest in upgrading their data architecture to enable a real-time, comprehensive view of how consumers interact with their products and services. With this structure in place, leaders can develop unique ways to solve customer problems.
数据图谱会重塑每一个领域的竞争,速度之快超过大多数人的预想。每家企业都应当超越利用数据改善运营效率的诉求,认识到数据图谱的竞争优势。高层领导者必须投资升级数据基础设施,实时、全面地了解消费者与本公司产品及服务交互的情况。有了这个结构,就能制定出独特的方案解决客户的问题。
维贾伊·戈文达拉扬是达特茅斯大学塔克商学院考克斯杰出教授,哈佛商学院执行研究员。
文卡特·卡特拉曼是波士顿大学奎斯特罗姆商学院管理学小戴维·麦格拉思教席教授。
蒋荟蓉|译 牛文静|校 时青靖|编辑
本文有删节,原文见《哈佛商业评论》中文版2022年5月刊。
