【菜鸟博士学习】GNPS·Network Visualization in Cytoscape Cytoscape 的网络
Network Visualization in Cytoscape Cytoscape 的网络可视化
While we do provide in-browser visualization for networks, these are limited to a single component at a time. Using Cytoscape, we can start visualizing the entire molecular network at once.
虽然我们确实为网络提供了浏览器内可视化,但是每次只能使用一个组件。使用细胞景观,我们可以立即开始可视化整个分子网络。
Cytoscape is an open source software platform for visualization and annotation of networks. Cytoscape is available for download from here. The instructions below assume that you have installed Cytoscape 3.6.X.
Cytoscape 是一个用于网络可视化和注释的开源软件平台。细胞景观可从这里下载。下面的说明假设您已经安装了 Cytoscape 3.6. x。
Cytoscape 3.6 Analysis (Quick)
To quickly get started with your molecular network in Cytoscape, we have an easy export module from GNPS that previews the molecular network and provides a pre-formatted Cytoscape file. This feature is very much experimental, but from the status page, click the "Direct Cytoscape Preview/Download"
为了快速开始与您的分子网络在 Cytoscape,我们有一个简单的导出模块从 GNPS,预览分子网络,并提供了一个预格式化的细胞景观文件。这个特性是非常实验性的,但是从状态页面,点击“直接细胞景观预览/下载”
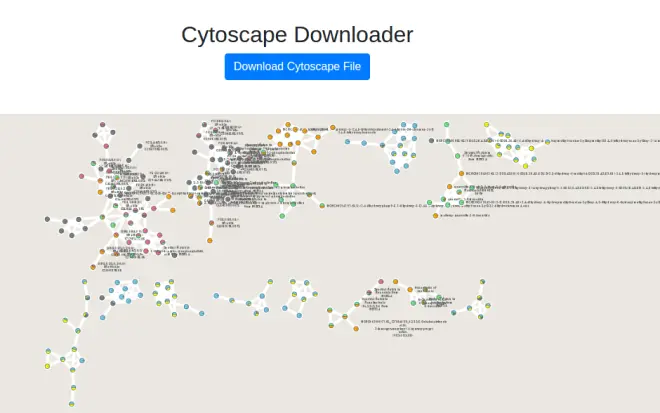
This will bring you to a new interface where you will see a preview and a download link.
这将带您到一个新的界面,您将看到一个预览和下载链接。
To re-style it with our presets, at the bottom we have a few styles already populated.
为了重新样式与我们的预设,在底部,我们有一些样式已经填充。
Contributing Alternative Styles
提供不同的风格
If you would like to suggest a new style, please send us a .cys file and the name of the style you have created within the Cytoscape file for us to add.
如果你想推荐一种新款式,请寄给我们一份。Cys 文件和样式的名称,您已创建的细胞景观文件中为我们添加。
Cytoscape 3.6 Analysis (Recommended) 细胞景观3.6分析(推荐)
Downloading Cytoscape Import Files 下载细胞景观导入文件
The first step is to download the correct input to import into Cytoscape. From the results page of molecular networking, you will need to download the graphML file for Cytoscape.
第一步是下载正确的输入导入到 Cytoscape 中。从分子网络的结果页面,您将需要下载针对 Cytoscape 的 graphML 文件。
Unzip the content of the zip file. The content will look like this:
解压 zip 文件的内容,内容如下:
Importing Network into Cytoscape 将网络导入细胞景观
Now open Cytoscape 3.6.1. From the Toolbar go to File / Import / Network / File (or cmd + L) and then select the .graphml file in the root of the unzipped job folder.
现在打开 Cytoscape 3.6.1。从工具栏转到 File/Import/Network/File (或 cmd + l) ,然后选择。在解压缩后的作业文件夹的根目录中放置 graphml 文件。
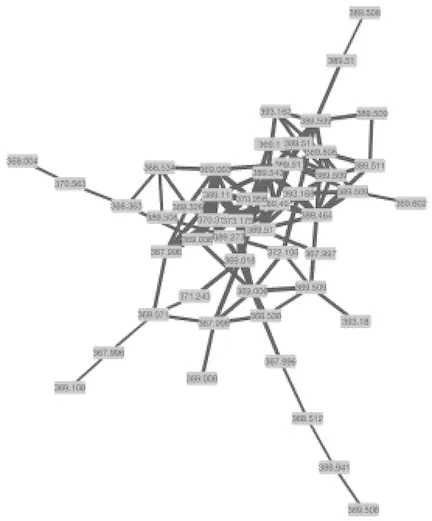
The network has been opened and will look like this.
这个网络已经打开了,将会是这个样子。
Creating a Cytoscape Style 创建细胞景观风格
In Cytoscape 3.6.1, create a new Cytoscape style. As shown below, click on "Create New Style" and provide a name.
在细胞景观3.6.1中,创建一个新的细胞景观样式。如下所示,单击“创建新样式”并提供一个名称。
Node Styling 节点样式
Node Label to Spectrum Property 频谱属性的节点标记
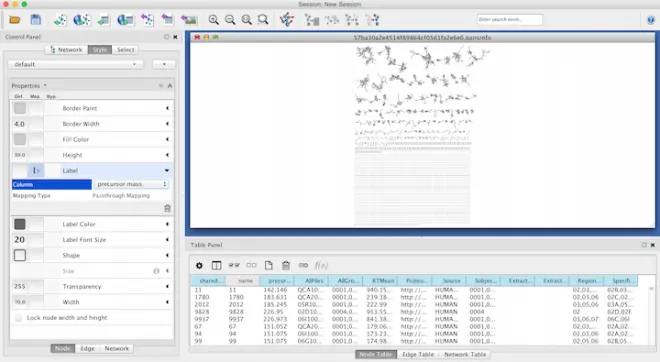
Within the Node menu, you will be able to Apply a label to each of your nodes, you may select the Attribute from the drop down menu to use as a label and then select Passthrough MApping as the MApping Type. Typically Parent mass or Precursor mass is selected for node labels of networks generated using GNPS.
在 Node 菜单中,你可以对每个节点应用一个标签,你可以从下拉菜单中选择 Attribute 作为标签,然后选择 Passthrough MApping 作为映射类型。通常,为使用 GNPS 生成的网络的节点标签选择父质量或前驱质量。
Visualizing Group Abundances as Pie Charts 可视化群组丰度为饼图
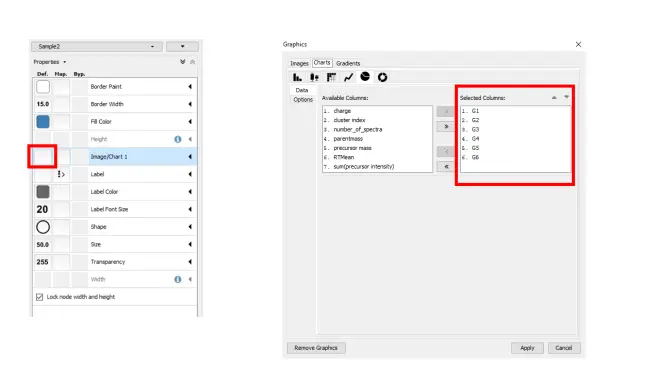
If you organized your data into cohorts of samples, we can visualize the relative abundance (as measured by spectral counts which is psuedo-quantitative) with pie charts across these groups.
如果你把你的数据组织成样本的队列,我们可以用饼图来显示这些组中的相对丰度(通过光谱计数量度量)。
Visualizing Structures 可视化结构
The Cytoscape plugin ChemViz2 can visualize the chemical structure of GNPS spectral library annotation in the nodes. The ChemViz2 plugin can be be installed in the toolbar Apps /Apps manager / and type "ChemViz2" to find and install it.
Cytoscape 插件 chemviz2可以将 GNPS 光谱库注释的化学结构可视化到节点中。可以在工具栏 Apps/Apps manager/中安装 chemviz2插件,并键入“ ChemViz2”来查找和安装它。
To visualize chemical structures, select the nodes of interest and do right-click, Apps / Cheminformatics tools / Paint structure on selected nodes.
为了可视化化学结构,选择感兴趣的节点,然后右键单击 Apps/Cheminformatics tools/Paint structure on selected nodes。
Also check out their website.
还可以看看他们的网站。
Edge Styling 边缘造型
Edge Thickness based on Spectral Similarity 基于光谱相似度的边缘厚度
To aid in the visualization of individual node relatedness within a cluster, the cosine score is used. This value will determine the thickness of the edge between related nodes. The thicker the edge, the higher the cosine score and therefore the more related the two individual nodes are to each other.
为了帮助可视化集群中各个节点的相关性,使用了余弦得分。此值将确定相关节点之间边缘的厚度。边缘越厚,余弦得分越高,因此两个单独的节点之间的相关性越强。
Again working within the Style Tab, select the Edge menu. From the Width drop down menu, select Cosine for the Column and Continuous MApping for the MApping Type.
再次在“样式”选项卡中工作,选择“边缘”菜单。在 Width 下拉菜单中,为 Column 选择 Cosine,为 MApping Type 选择 Continuous MApping。
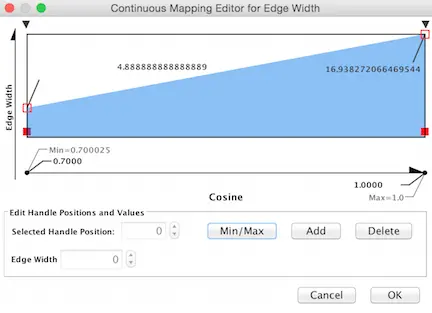
Double click on the Continuous MApping area of the menu to adjust the thickness of the edge. Click OK to Apply the setting changes.
双击菜单的连续映射区域来调整边缘的厚度。单击 OK 应用设置更改。
Below is a zoomed in portion of a network demonstrating the use of Cosine score for edge width determination.
下面是网络的缩放部分,演示如何使用余弦得分确定边缘宽度。