python使用matplotlib绘制简单图形
1,绘制一个圆
import matplotlib.pyplot as plt
def creat_circle():
circle=plt.Circle((0,0),radius=0.5,fc='y',ec='r')#圆心坐标,半径,内部及边缘填充颜色
return circle
def show_shape(path):
ax=plt.gca() #获取当前对象
ax.add_patch(path) #给对象传递添加的块
ax.set_aspect('equal') #设置图形的宽高比,equal为1:1
plt.axis('scaled') #设置自动调节数轴范围
plt.show()
c=creat_circle()
show_shape(c)
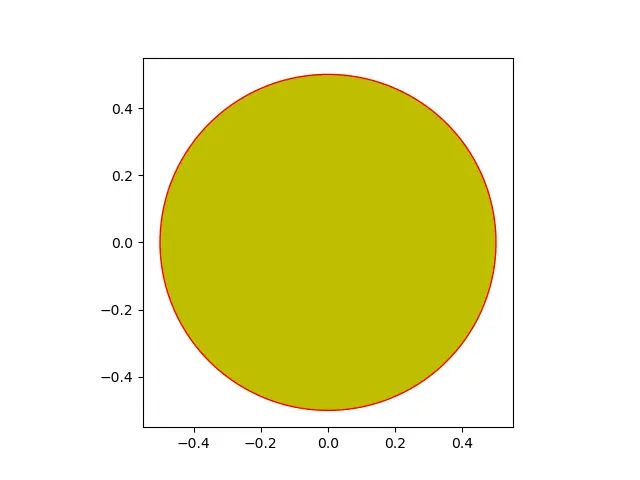
2,绘制动图
from matplotlib import pyplot as plt
from matplotlib import animation
def creat_circle():
circle=plt.Circle((0,0),radius=0.05,fc='y',ec='r')#圆心坐标,半径,内部及边缘填充颜色
return circle
def update_radius(i,circle):#调用时自动传递的帧编号,每一帧需要的对象;返回也是一个帧对象
circle.radius=i*0.5
return circle
def creat_animation():
fig=plt.gcf() #获取当前Figure对象的引用
ax=plt.axes()#创建坐标系并设定取值范围
plt.xlim(-10,10),plt.ylim(-10,10)
ax.set_aspect('equal')
circle=creat_circle()
ax.add_patch(circle) #将圆添加到当前坐标系下
anim=animation.FuncAnimation(
fig,update_radius,fargs=(circle,),frames=30,interval=50)#传给FunAnimatin绘制动图的参数
#依次为:当前Figure对象,绘制每帧的函数,给前面的函数通过元组传递参数(帧数不用传递)
#帧数(这里选30帧),两帧之间的时间间隔(这里是50毫秒)
plt.title('Dynamic circle')#设置标题
plt.show() #显示动图
anim.save('circle.gif',writer='imagemagick')#在当前目录下保存动图
creat_animation()
3,绘制抛物线动图:
from matplotlib import pyplot as plt
from matplotlib import animation
import math
g=9.8
def get_intervals(u,theta): #u为初合速度,theta为合速度与地面夹角
t_flight=2*u*math.sin(theta)/g
#由抛物线公式得:总飞行时间为两倍的竖直方向速度除竖直加速度g
intervals=[]
start=0
interval=0.005
#以0.5为间隔创建列表,以便于后续帧与帧之间代表物体运动的时间间隔为0.5
while start<t_flight:
intervals.append(start)
start+=interval
return intervals
def update_position(i,circle,intervals,u,theta):#更新每一帧坐标
t=intervals[i] #传递每一帧对应的物体实际运动时间
x=u*math.cos(theta)*t
y=u*math.sin(theta)*t-0.5*g*t*t
#根据抛物线公式算出确定时间下对应的位置坐标
circle.center=x,y #传入球心坐标
return circle
def create_animation(u,theta):
intervals=get_intervals(u,theta)
xmin,ymin=0,0
xmax=u*math.cos(theta)*intervals[-1]
#以最大时间值算出x坐标最大值
tmax=u*math.sin(theta)/g
#飞到最高点所用时间
ymax=u*math.sin(theta)*tmax-0.5*g*tmax**2
#最高点纵坐标
fig=plt.gcf()
ax=plt.axes()
plt.xlim(xmin,xmax),plt.ylim(ymin,ymax)
circle=plt.Circle((xmin,ymin),0.1) #从起点开始画圆
ax.add_patch(circle)#添加圆在坐标系下
ax.set_aspect('equal')
anim=animation.FuncAnimation(fig,update_position,fargs=\
(circle,intervals,u,theta),frames=len(intervals),interval=1)
#这里可以参加参数repeat=False让动图不要无限重复
plt.title('parabolic movement')
plt.xlabel('X')
plt.ylabel('Y')
plt.show()
anim.save('move.gif',writer='imagemagick')
try:
u=float(input('enter the initial velocity:'))
theta=float(input('enter the angle of projection:'))
except: #避免错误输入
print('wrong input')
else:
theta=math.radians(theta)#转为弧度制
create_animation(u,theta)
当我输入初速度为10,角度为45
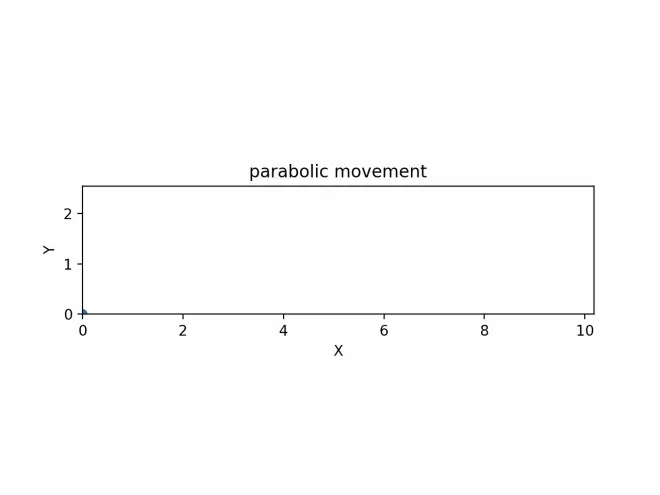
4,绘制分形:
'''
绘制分形:
其实就是由一些简单的图形组合而成
这些独立的图形需要提供初始位置和递推关系式(类似于数列的感觉)
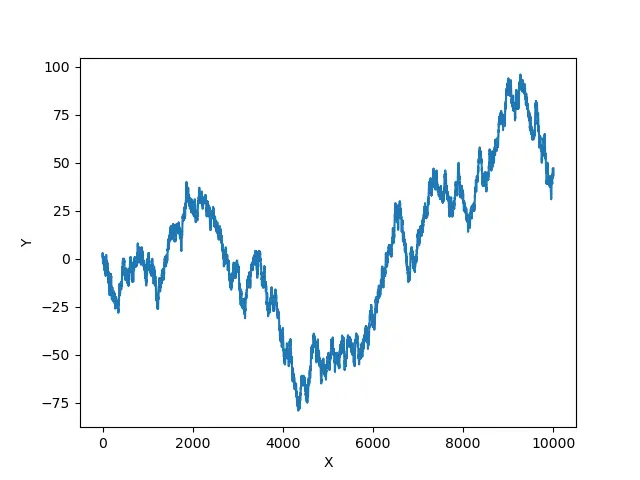
下面举一个随机游走的例子,即下一个点的坐标,横坐标加一,纵坐标可能加一或者减一
'''
from matplotlib import pyplot as plt
import random
def trans1(p):#p为储存x,y坐标的元组,先往下看
#纵坐标+1
x=p[0]
y=p[1]
return x+1,y+1
def trans2(p):
#纵坐标-1
x=p[0]
y=p[1]
return x+1,y-1
def transform(p):
trans=[trans1,trans2] #将函数作为对象
t=random.choice(trans) #随机选择一个函数
x,y=t(p) #对选中的函数进行调用
return x,y
def update_site(p,n):#n为坐标随机更新次数
x=[p[0]]
y=[p[1]]#创建列表先存入初始坐标
for _ in range(n):
p=transform(p) #随机调用函数更新坐标
x.append(p[0])
y.append(p[1])#存入更新后的坐标值
return x,y #返回完整的坐标列表
p=(1,1) #初始位置
n=int(input('enter the number of tries:'))
x,y=update_site(p,n)
plt.plot(x,y) #根据返回列表绘制
plt.xlabel('X')
plt.ylabel('Y')
plt.show()
比如我输入10000
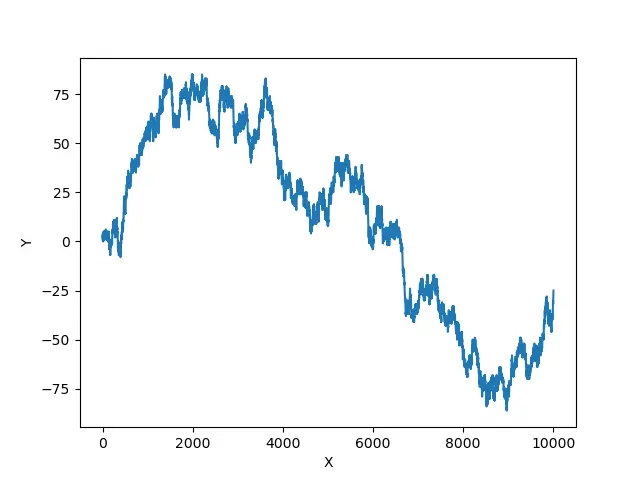
同样的输入,每次输出结果也不一样。
5,更有趣的是,我们可以绘制一些有趣的图形。
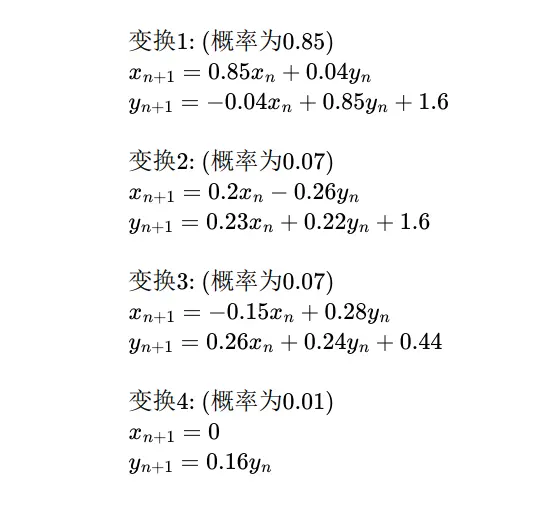
原理:以一个确定的点,但按照实现分配的概率执行变换规则(依概率执行递推关系式)
from matplotlib import pyplot as plt
import random
def trans1(p):
x=p[0]
y=p[1]
x1=0.85*x+0.04*y
y1=-0.04*x+0.85*y+1.6
return x1,y1
def trans2(p):
x=p[0]
y=p[1]
x1=0.2*x-0.26*y
y1=0.23*x+0.22*y+1.6
return x1,y1
def trans3(p):
x=p[0]
y=p[1]
x1=-0.15*x+0.28*y
y1=0.26*x+0.24*y+0.44
return x1,y1
def trans4(p):
x=p[0]
y=p[1]
x1=0
y1=0.16*y
return x1,y1
#非均匀随机数
def unequal_probability_random_number(probability):
#输出调用函数的位置
begin=0
sum_probability=[] #从分布函数角度来实现
for p in probability:
begin+=p
sum_probability.append(begin) #记录每个离散点的分布函数值
r=random.random() #产生0到1均匀随机数
for index,distribution in enumerate(sum_probability):
if r<=distribution:
return index
return len(probability-1)
def transform(p):
trans=[trans1,trans2,trans3,trans4]
probability=[0.85,0.07,0.07,0.01]#设置各个函数调用概率
site=unequal_probability_random_number(probability)
t=trans[site] #依概率选择一个函数
x,y=t(p) #对选中的函数进行调用
return x,y
def update_site(n):
x=[0]
y=[0]#创建列表先存入初始坐标
x1,y1=0,0
for _ in range(n):
x1,y1=transform((x1,y1))
x.append(x1)
y.append(y1)#存入更新后的坐标值
return x,y #返回完整的坐标列表
n=int(input('enter the number of tries:'))
x,y=update_site(n)
plt.plot(x,y,'o') #绘制点
plt.xlabel('X')
plt.ylabel('Y')
plt.show()
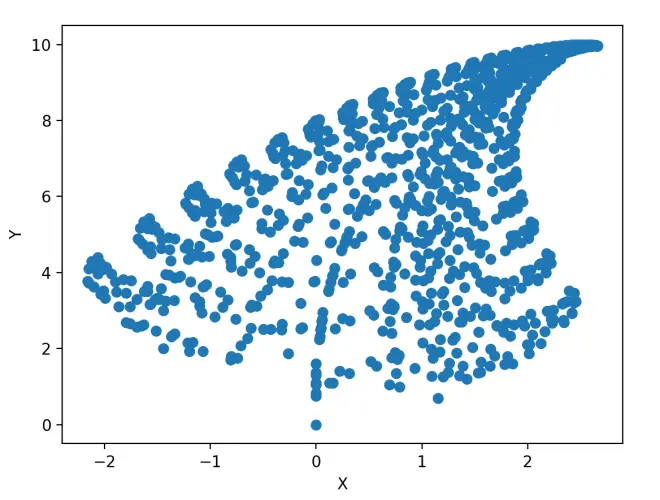
比如输入n=1000
亦或者输入n=5000
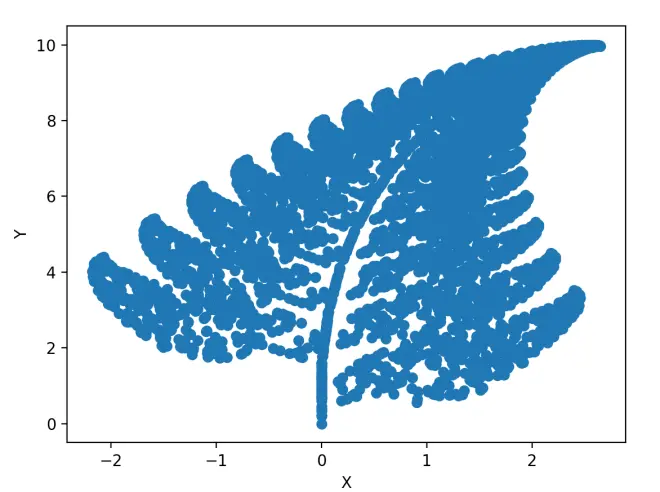
恩,它现在很像一个蕨类植物了,有趣吧~~~

