银行案例学习实例2_数据细分和衍生变量
up主微信公众号pythonEducation
python金融风控评分卡模型和数据分析微专业课:http://dwz.date/b9vv

Sherlock Holmes & Data Visualization

Sherlock Holmes – by Roopam
As a kid, a friend of mine used to own a Sherlock Holmes toy kit – the source of envy for all the other friends. The kit had a Sherlock Holmes cap, a pipe, a watch and a magnifying glass. The magnifying glass was the most coveted item in the kit. The pleasure of focusing the magnifying glass on an object and seeing it in detail to derive meaning was my first lesson in detective investigation – something that I still relish as an analyst. This is also the core of data visualization. Later, I learned more about Mr. Holmes through the books written by Sir Arthur Conon Doyle. The first book, A Study in Scarlet, describes Mr. Holmes’ inclination for scientific knowledge and the science of deduction – analysis. I realized being a detective is no different from being an experimental scientist or analyst. You start with gathering a set of observations, using which you built your case through logic and deduction. The following quote by Mr. Holmes’ perfectly describes the process of investigation – when you have eliminated the impossible, whatever remains, however improbable, must be the truth
小时候,我的一个朋友曾经拥有一个夏洛克·福尔摩斯玩具包 - 这是所有其他朋友羡慕的源头。该套件有一个Sherlock Holmes帽,一个管子,一块手表和一个放大镜。放大镜是套件中最令人垂涎的项目。将放大镜聚焦在物体上并详细观察它以获得意义的乐趣是我在侦探调查中的第一课 - 我仍然喜欢作为分析师。这也是数据可视化的核心。后来,我通过阿瑟·康恩·道尔爵士写的书,更多地了解了霍姆斯先生。第一本书“血色研究”描述了霍姆斯先生对科学知识和演绎科学的倾向 - 分析。我意识到自己是一名侦探与做实验科学家或分析师并无二致。您首先收集一组观察结果,通过逻辑和演绎来构建您的案例。霍姆斯先生的以下引言完美地描述了调查的过程 - 当你消除了不可能的事物时,无论遗骸多么不可能,都必须是真理
Data Visualization – A Case Study Example

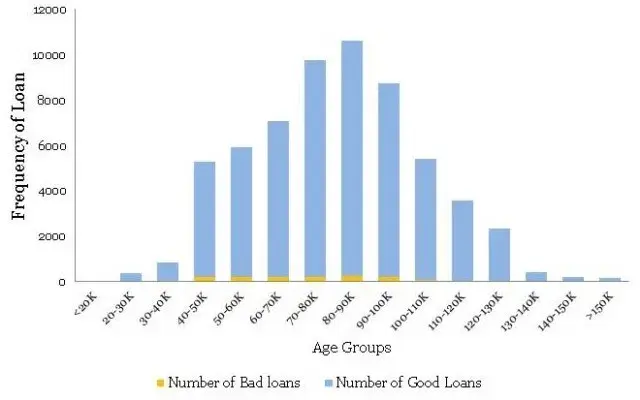
In our last article, we started with a case study example about CyndiCat bank that has disbursed 60816 auto loans in the quarter between April–June 2012. You were playing the role of the Chief Risk Officer (CRO) for this bank. Additionally, you had noticed around 2.5% of bad rate or 1524 bad loans out of total 60816 disbursed loans. You started with a hunch预感/直觉 about the relationship between the age of the borrowers and the bad rates. After your analysis, you observed a definitive inversely proportional relationship between the two. Age of the borrowers certainly seemed like a strong contender for your credit risk model. You are feeling good and want to find a few more variables for your multivariate model. (Read the previous article)
在我们的上一篇文章中,我们从一个关于CyndiCat银行的案例研究示例开始,该银行在2012年4月至6月期间在该季度发放了60816个汽车贷款。您担任该银行首席风险官(CRO)的角色。 此外,在60816笔已发放贷款中,您注意到约2.5%的不良利率或1524笔不良贷款。 你开始预感借款人的年龄与不良利率之间的关系。 在分析之后,您观察到两者之间的确定的反比关系。 借款人的年龄当然似乎是您信用风险模型的有力竞争者。 您感觉良好,并希望为您的多变量模型找到更多变量。 (阅读上一篇文章)
国内某些数据测试,年龄与 坏客户率成正比,也许还有第三方因素决定,比如政策法规。美国政策严格。
The Case Study Example Continues…
You also believe that income of the applicants should have some sort of relationship with the bad rates. You are feeling confident about your understanding of the tools you have used last time around i.e. histogram and normalized histogram (overlaid with good / bad borrowers). You immediately start by plotting an equal interval histogram and observe the following:
您还认为申请人的收入应该与不良利率有某种关系。 您对自己对上次使用的工具的理解充满信心,即直方图和标准化直方图(覆盖好/坏借款人)。 您可以立即绘制相等的间隔直方图,并观察以下内容:
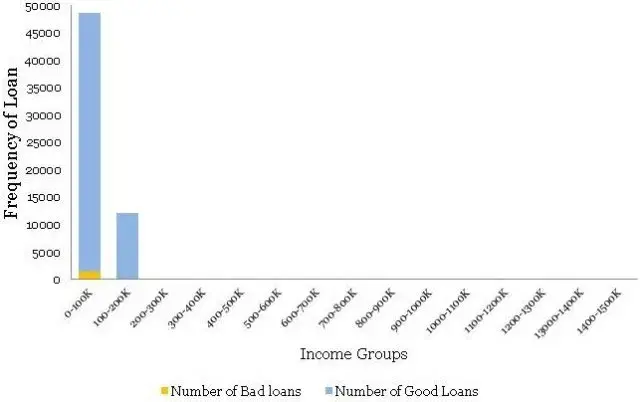
Ouch! This is nothing like the smooth bell curve histogram you have observed for the age groups. Even the normalized histogram, shown below, is completely uninformative.
哎哟! 这与您在年龄组中观察到的平滑钟形曲线直方图完全不同。 即使是如下所示的标准化直方图也完全无法提供信息。
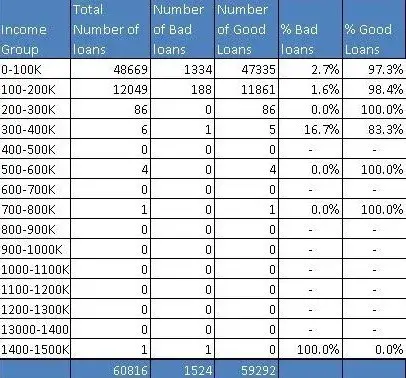
So, what is going on here? Income, unlike age, has a few extreme outliers – almost invisible in the histogram. There is a High-Net worth-Individual (HNI) with $1.47 million annual salary and few other outliers in the middle. Incidentally, this loan to the HNI customer has gone bad – quite unfortunate for the Bank. Have a look at the distribution table – almost 99.8% population is in the first two income buckets.
那么,这里发生了什么? 与年龄不同,收入有一些极端异常值 - 在直方图中几乎不可见。 有一个高净值个人(HNI),年薪为147万美元,中间几乎没有其他异常值。 顺便提一下,这笔给HNI客户的贷款变坏了 - 这对银行来说非常不幸。 看一下分配表 - 几乎99.8%的人口都在前两个收入桶中。
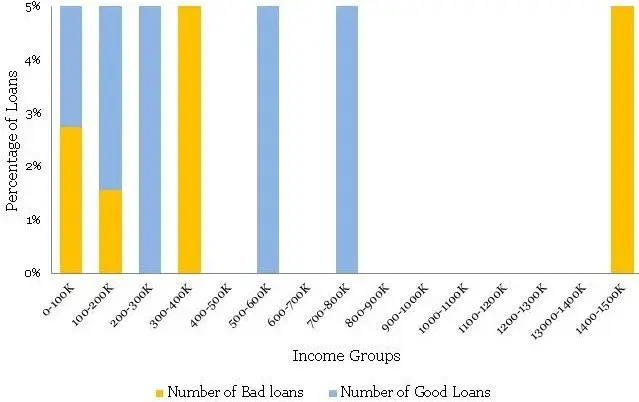
Here, as an analyst, you need to take a call whether you want to include these extreme cases, with thin data, in your model or create an income boundary for which the model is applicable for the majority of the customers. In my opinion, the latter option is a prudent choice. Going further with your exploratory analysis and data visualization, you have decided to zoom into the regions with a predominant number of data points i.e. first two buckets and re-plotted the histogram. The following is what you observed
在这里,作为分析师,您需要接听电话,无论您是想在模型中包含这些具有少量数据的极端情况,还是创建适用于大多数客户的模型的收入边界。 在我看来,后一种选择是谨慎的选择。 进一步研究探索性分析和数据可视化,您决定放大(细分)具有大量数据点的区域,即前两个数据区域,并重新绘制直方图。 以下是您观察到的内容
* Correction: Read X axis as Income Groups (not Age Groups)
This time, the histogram is reasonably smooth and hence does not require transformation. Presented below is the normalized histogram for the above histogram.
这次,直方图相当平滑,因此不需要变换。 下面给出的是上述直方图的归一化直方图。
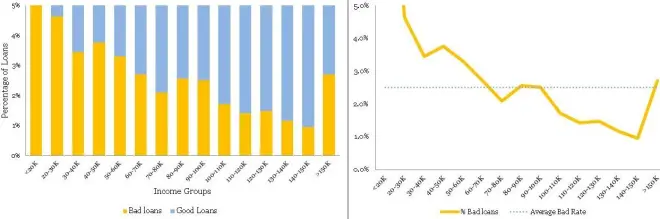
The following conclusions can be drawn from the above
• There is a definite trend in terms of the bad rates and the income groups. As the borrowers are earning a higher salary, they are less likely to default on their loans. This seems like a good insight.
• For the Last bucket i.e. >150 K, the risk jumps up – a break in the trend. This is attributed to the thin data in this bucket – not just in terms of data count but this data is also spread across a very large interval 150 to 1500 K.
Now you have two variables that are possible governing bad rates for the borrowers – age and income. However, your further analysis of income with age shows that there is a high correlation between the two variables – 0.76 to be precise. You cannot use them both in the model because it will be problematic because of multicollinearity. The correlation between age and income makes sense. Since income is a function of years of experience for a professional, this further depends on upon her age. Hence, you have decided to drop income from the model. The leaves us with a question, is there a way of bringing income back in our multivariate model?
在不良利率和收入群体方面存在明显的趋势。由于借款人的薪水较高,他们不太可能拖欠贷款。这似乎是一个很好的见解。
•对于最后一桶,即> 150 K,风险会上升 - 趋势中断。这归因于此数据库中的数据太少 - 不仅仅是数据计数,而且这些数据也分布在150到1500 K的非常大的区间内。
现在你有两个变量可以控制借款人的不良利率 - 年龄和收入。然而,您对年龄收入的进一步分析表明,两个变量之间存在高度相关性 - 准确地说是0.76。你不能在模型中使用它们,因为它会因多重共线性而成为问题。年龄和收入之间的相关性是有道理的。由于收入是专业人士多年经验的函数,这进一步取决于她的年龄。因此,您决定从模型中减少收入。给我们留下一个问题,是否有办法将收入带回我们的多元模型?
Financial Ratios
组合变量-Fixed Obligation to Income Ratio固定债务和收入比率 (FOIR)
When corporate analysts try to analyze financials of a company they often work with several financial ratios. Working with ratios has a definite advantage over working with plain vanilla variables. Combined variables often convey much higher information. Seasoned analysts understand this really well. Moreover, variables creation is a creative exercise that requires sound domain knowledge. For credit analysis, the ratio of the sum of obligations to income is highly informative since this provides an insight about percentage disposable income for the borrower.
Let us try to understand this with an example. Susan has an annual income of 100 thousand dollars. She has a home loan with an annual obligation (EMI) of 40 thousand dollars and a car loan with 10 thousand dollars. Hence, she is spending 10+40 thousand dollars on paying the EMIs out of her income of 100 thousand dollars. Her Fixed Obligation to Income Ratio固定债务和收入比率 (FOIR) in this case is equal to 50/100 = 50%. She is left with just 50% of her income to run her other expenses.
The following is the normalized histogram plot for FOIR.
财务比率
当企业分析师试图分析公司的财务状况时,他们经常使用多种财务比率。使用比率与使用普通的vanilla变量相比具有明显的优势。组合变量通常会传达更高的信息。经验丰富的分析师非常了解这一点。此外,变量创建是一项创造性的练习,需要良好的领域知识。对于信用分析,债务与收入之和的比率具有很高的信息量,因为这可以提供有关借款人可支配收入百分比的见解。
让我们试着通过一个例子来理解这一点。苏珊的年收入为10万美元。她有一笔住房贷款,年度义务(EMI)为4万美元,汽车贷款为1万美元。因此,她花费10 + 4万美元从她的收入10万美元中支付EMI。在这种情况下,她的固定义务收入比率(FOIR)等于50/100 = 50%。她只有50%的收入用于支付其他费用。
以下是FOIR的标准化直方图。
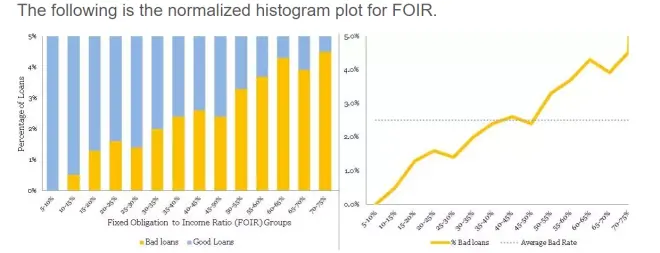
Clearly, there is a directly proportional relationship between FOIR and bad rate. Additionally, FOIR has little correlation with age, just 0.18. Now, you have another variable FOIR , along with age, for your multivariate model. Congratulations! Like, Sherlock Holmes, you are building your case evidence by evidence – a process in science.
Sign-off Note
I hope after this you are feeling inspired to pick up the magnifying glass and follow the legacy of the great Sherlock Holmes – this time the mystery is hiding in data!
显然,FOIR与不良率之间存在直接比例关系。 此外,FOIR与年龄几乎没有相关性,仅为0.18。 现在,您的多变量模型还有另一个变量FOIR和年龄。恭喜! 就像Sherlock Holmes一样,你正在通过证据建立你的案件证据 - 一个科学过程。
签字笔记
我希望在此之后你会感到鼓舞,拿起放大镜并追随伟大的夏洛克福尔摩斯的遗产 - 这一次神秘隐藏在数据中!
博主网校主页http://dwz.date/bwes