
遗传 进化与生态学 15 - Hardy Weinberg
本期的内容为哈迪-温伯格定律。本文集的这一部分是遗传、进化与生态学 Genetics, Evolution, and Ecology. 这门课理论上建议在阅读完文集的第一部分的内容之后再开始学习,但基础不足的朋友也可以尝试阅读喔~
这一部分的主要内容均来自 Prof. Angela J. Roles 的 BIOL 200 课程,因此本文集的这一部分均不会标记为原创。但由于文本来源不清晰,UP主还是一个字一个字码出来的文章,本文禁止非授权的转载,谢谢!
Lesson 15: Population Genetics: Hardy-Weinberg
[1] Populations
Important vocabulary for genetics of populations:
Locus: refers to a particular region of DNA of a chromosome; may or may not be coding DNA; plural is loci.
Gene: a functional unit of DNA coding for a protein (or an active RNA). A gene is also a locus.
Allele: a variant form of a locus (e.g., purple vs. white alleles for flower color OR 18 vs. 20 repeat units for microsatellite loci).
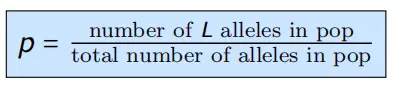
Allele frequency: the proportion of total alleles in the population that are represented by a particular allele. (The total number of alleles is 2 times the population size for an autosomal locus in a diploid.).
Genotype frequency: the proportion of individuals in the entire population that possess a particular genotype
Genome-wide association studies (GWAS)
- From individuals to populations
How can we use linkage to find genes underlying phenotypes?
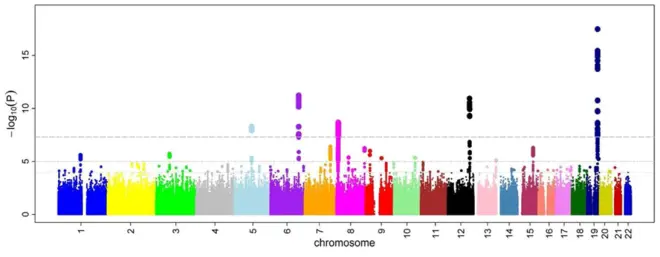
Genome-Wide Association Studies (GWAS): Sample populations, look for an association between the phenotype and a genetic location.
- Correlating phenotype to genotype to find genes involved in disease
(1) Sample people with and without a disease phenotype (ex: indicators of cardiovascular disease);
(2) Genotype: for each person, sequence thousands of SNP loci (single nucleotide polymorphisms) across the genome;
(3) Correlate phenotype and genotype to identify loci that are linked to potential disease-related genes;
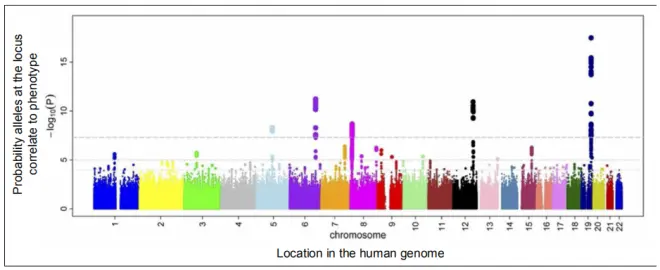
Additional work needed to find potential causal genes and test for effects on phenotype (each SNP locus might be linked to hundreds of candidate genes).
Identify candidate loci: Compare genotypes between those with vs. without the
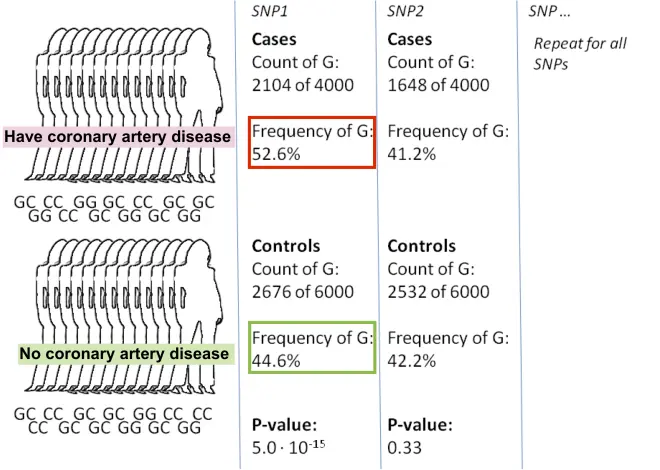
SNP1 (a single base pair in the DNA sequence) is more often a G in individuals with the disease phenotype than in individuals without the disease phenotype.
Thus, there is linkage between SNP1 and coronary artery disease.
[2] Frequencies
Imagine a population of plants...
▸Let’s consider a population of monkey flower plants, which have flowers in 3 colors: pink, orange, and red (as below). This color difference is related to the production of carotenoid pigments (more carotenoids = more orange/red color).
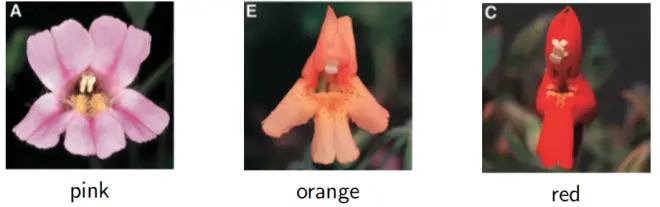
▸In a population in nature, we find all three flower colors (any given plant has flowers of a single color). To start, we want to determine how common plants of each flower color are.
Calculating observed (obs) genotype frequencies
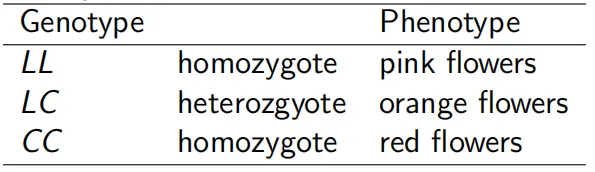
▸Consider the CAR locus with 2 alleles: L = encodes no carotenoids and C = encodes carotenoid production:
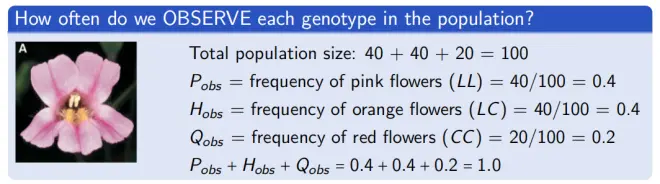
▸Imagine you count 40 pink, 40 orange, and 20 red-flowered plants. N = 100 total.
How common is each allele in the population?
- Allele Frequencies Method 1: Counting up alleles
How many total alleles? N=100 individuals, 2 alleles each so 2N = 200 alleles;
How many L alleles? (40 pink × 2 each) + (40 orange × 1 each) = 120 L alleles;
How many C alleles? (20 red × 2 each) + (40 orange × 1 each) = 80 C alleles;
Allele frequencies are: p = frequency of L = 120/200 = 0.6, q = frequency of C = 80/200 = 0.4.
- Allele Frequencies Method 2: Use observed genotype frequencies
Recall: P(obs) = freq of LL = 0.4, H(obs) = freq of LC = 0.4, Q(obs) = freq of CC = 0.2;
Thus: p = P(obs) + H(obs)/2 = 0.4 + 0.4/2 = 0.6, q = Q(obs) + H(obs)/2 = 0.2 + 0.4/2 = 0.4.
*Remember that the sum of all allele frequencies must be 1.0.*
Calculating expected (exp) genotype frequencies
The same ideas that underlie Punnett squares as predictors of offspring ratios in a genetic cross can be used to calculate the genotype frequencies we’d expect BY CHANCE given the allele freuqencies that we have in our sample.
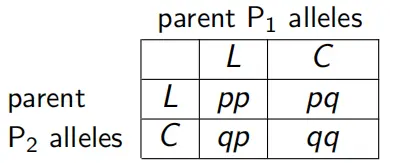
What is the probability that the allele from the male parent is an L allele? And from the female parent?
Thus, the probability that two L alleles are randomly joined to make a homozygous L zygote is:
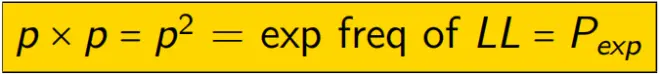
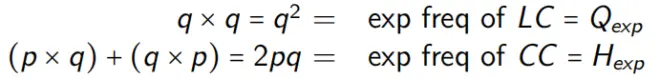
For other genotypes, we expect:
[3] The Hardy Weinberg (HW) Principle:
Hardy Weinberg Principle: Modeling stasis
▸In the absence of forces causing change, allele and genotype frequencies will remain the same over time.
▸Assumptions for no genetic change at a locus:
(1) Mating is random with respect to genotype for this locus;
(2) No mutation at this locus;
(3) No natural selection (all genotypes have equal rate of survival and reproductive success);
(4) No gene flow (no gametes or individuals are entering or leaving the population);
(5) The population is large (genetic drift, random change in frequency, is not occurring).
▸ Assumptions for no change at a locus: random mating; no mutation; no selection; no gene flow; no genetic drift
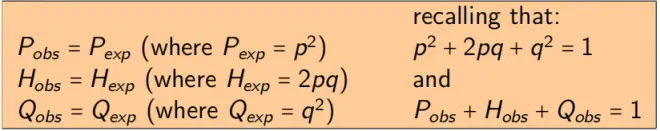
If the assumptions are met, then we predict:
(1) Allele frequencies do not change over generations, p of time 1 = p of time 2;
(2) Genotype frequencies within a generation are a simple function of allele frequencies:
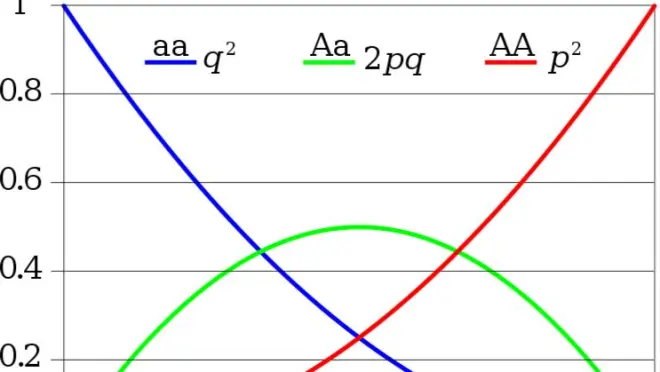
HW Expected: equilibrium for any value of p
Expected genotype frequencies for any value of p, when in HW
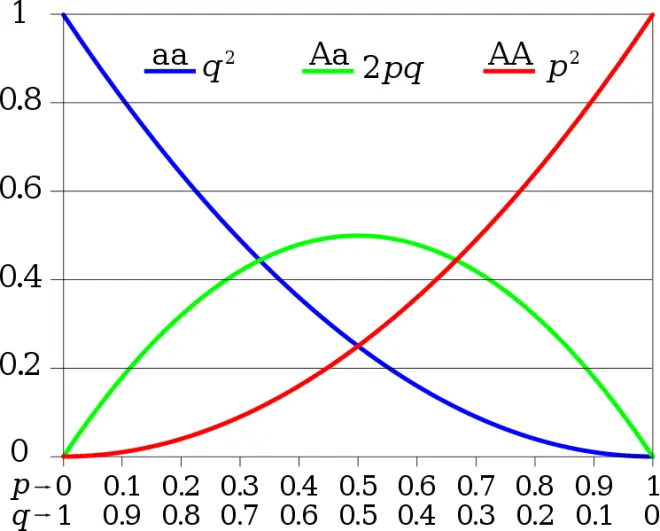
▸x-axis shows allele frequencies;
▸y-axis shows expected genotype frequencies;
▸Expected heterozygosity is maximized when p = q = 0.5;
▸When an allele is rare, we expect most copies of it to be found in heterozygotes.
